SENTEK / GEMS
Sentek understand that good sensor data is critical. GEMS is a scientifically calibrated, 4-band, multi-spectral camera integrated with an internal navigation system. The sensor is offered with their 3D reconstruction and orthomosaicing software suite. Sentek’s software uses the additional sensors on-board our cameras to decrease processing time and improve reliability, robustness, and accuracy. The result is a powerful and easy-to-use sensor and software combo.
GEMS post-processing software enables you to easily fly, collect, and process your crop data quickly and securely. Analysis on an image-by-image basis as well as 2D orthomosaics is enabled with GPS markers, distance measurements, and area statistics tools. Quickly identify problem areas and export data layers in industry-standard file formats.
Get a quick preview mosaic from your flight in a few minutes or less. Validate your data while you are still in the field.
Export a Geo-Registered point cloud from your flight for analysis in your favorite tools.
Get a digital elevation map of your field so you can locate and quantify high/low spots and ground slope.
Build multi-spectral orthomosaics and NDVI maps from your flights, optionally calibrated using our Incident Light Sensor accessory.
No need to transfer your data to remote processing servers. Process data locally and quickly on your own computer.
Measure distances and areas and get NDVI statistics. Quantify crop damage or stressed areas accurately and easily.
GEMS Brochure's


SENTEK / GEMS Tutorials
Specs
2017 Brochure
SENTEK/GEMS CROP IMAGE
See your crops in a way that clearly identifies problem areas.
NDVI Explained
A simple overview of how drones are used in the farming industry to provide aerial imagery to create NDVI maps to improve crop yields, reduce farming costs, protect the environment and quantify crop damage insurance claims CASA recognizes that drones are essential to increasing the productivity of farmlands. Small drones pose a limited risk of injuring people, other aircraft, and property. Thus CASA approval to use drones for farming is here.
Daylight operation
LOS (Line of Sight) Operation
120 metre Ceiling
Various safety devices, pilot and aircraft certifications, training, safety protocols, etc.
Agronomists using drones to assist their recommendations for fertilizer and pesticide application can improve the bottom line to farmers by as much as 15% and help the environment as well. The world's farmers must increase yields to feed the world's rapidly growing population. Drones are the latest technological advancement to assist in increasing crop yields while lowering pollution and costs.
Large fields and tall crops are extremely difficult to assess from the ground. Drones provide aerial access at a relatively low cost. Agronomists operate the drones themselves or hire local drone service providers to fly the fields.
Normalized Difference Vegetation Index (NDVI) is an extremely important tool to determine if crops are stressed. NDVI compares bands of light to accurately determine plant stress. This is state of the art technology.
Wikipedia explains NDVI in detail. Photos directly from the onboard NDVI compatible camera are unusable as is. The photos must undergo special processing. First, individual photos are stitched together to make one large photo. Online processors are used for this operation due to the high cost and complexity of the hardware and software.
The high quality single image is converted to a NDVI image. NDVI processing software is inexpensive and easy to use though the same online processors who stitched the photos offer this service inexpensively. The agronomist uses both the normal and the NDVI images with more traditional methods to assess plant stress. Plant stress can be detected well before it can be seen with the naked eye as well as after obvious damage is apparent.
The agronomist then performs "ground truthing" combined with other traditional methods to verify the NDVI data and determine the cause of the stress. Often the agronomist physically walks into the field and looks at the plants where the NDVI has identified problem areas. The agronomist then makes recommendations to the farmer. If variable rate applicators are used by the farmer, then varying rates of fertilizer and pesticides are recommended which reduce treatment costs, protect the environment by reducing unnecessary over-applications, and increase yields.
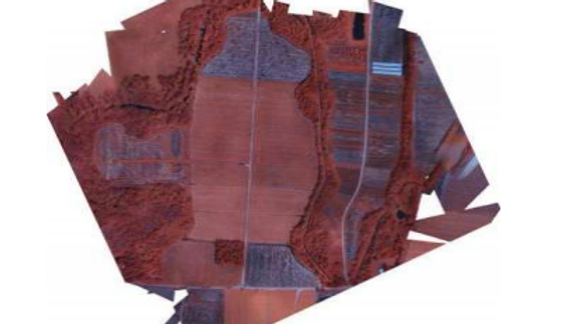
The three photos below are all derived from only one camera. Special processing converts the image from the NIR (red) image that is taken by the onboard camera to the "EO" (normal) image as well as the "NDVI" image. Only the EO (Electro-Optical or "normal") and the NDVI images are used by the agronomist.
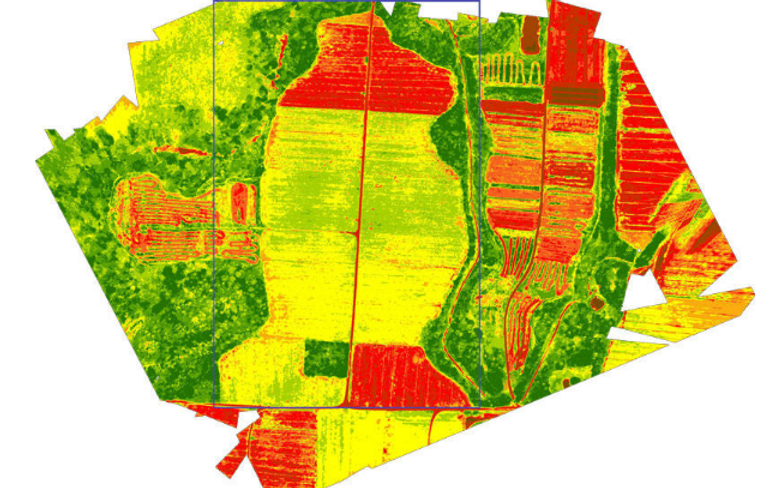
In the NDVI image the green areas are healthy, the red are not. The area we are concerned with is marked with a blue border. The area is a sod farm. In the NDVI photo the dark green areas around the sod is trees. The large patches of red are areas which were harvested. The red line down the middle is a dirt road. The small red patches of red mixed into the healthy green area are problem areas.
The problem is confirmed by looking at the EO photo and by physically walking into the field. There is no grass in the red spots. While you see a low resolution image here, the resolution of the actual photo is high enough to see individual blades of grass! The agronomist saves time because if bare earth, standing water or another obvious problem is identified using the EO image there is no need to walk the field. The sod farmer in this case uses this data to identify excessively large bare spots early on in the growing cycle to replant problem areas and improve yield per acre.

SENTEK / GEMS system is by far the best value for money. Aerial crop analyses needs to be available where ever and when ever the farmer needs it. With the confidence that his farm data is protected and owned by the farmer. No ongoing costs for imaging and lifetime software updates included in the purchase price.
At IDA we fit the camera as per the manufactures recommendations and test to ensure that when your drone arrives it is simply a matter of loading the program and collecting the data you need.
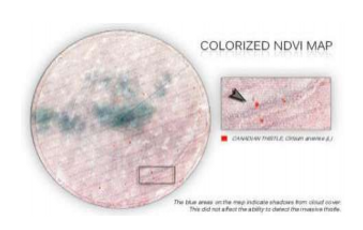
Invasive Species Detection: Canadian Thistle
An NDVI map helped confirm the presence of a Canadian Thistle infestation on this 122 acre corn field. A flat rate herbicide prescription was applied to the entire field. As shown in the aerial imagery, inspections confirmed that only 0.6 acres required treatment. An herbicide reduction of over 99% would have been possible with a variable rate prescription, decreasing the overall environmental impact and yield loss.
Crop: Corn
Location: NE Kansas
Acreage: 121.82
Environmental Impact Prescription: 10 gallons/acre (diluted) 6.6 pints/acre (concentrate)
Flat rate area: 121.82 acres
Variable rate area: (-) 0.60 acres 121.22 acres
Herbicide reduction: 1,212.2 gallons (diluted)
100.0 gallons (concentrate)
The future of crop analysis is here with the Sentek/GEMS system. Allowing stand alone results on your own computer in minutes, and no ongoing costs from cloud services. The outlay quickly pays for itself and the knowledge that your precious data in not shared with others. Pin point accuracy of crop conditions allows for minimal prescriptions to be applied to the field and new data to be available as often as you like.

